
Leadership Reviews
Chief Financial Officer's Review
Keeping aside our plans for growth, we quickly shifted gears during the year to focus on adapting to the highly uncertain economic, social, and political conditions, amidst muted credit demand and waning debt repayment capacity of borrowers.
GRI 201-1
An overview
For several years Sri Lanka has been facing multiple challenges hampering its prospects of progress – the drought in 2017, political turmoil in 2018, Easter Sunday Terrorist Attacks in 2019 and the COVID pandemic in 2020 following through to 2021, that constrained Sri Lanka’s economic prospects. These events along with the impact of significant tax and fiscal relaxation effected in 2019, further pushed Sri Lanka towards a vulnerable economic position, and led to 2022/23 being a tougher year. In 2022, Sri Lanka saw depletion in foreign reserves and marked depreciation of the currency against the USD, defaulted on bilateral and commercial public debt, and experienced sovereign rating downgrades. A surge in inflation along with the uncertainties on debt restructuring resulted in high interest rates. These developments coupled with a deep recession and social unrest led the country to witness political changes. Amidst the chaos, hope came about in the form of Sri Lanka receiving the IMF Board level approval in March 2023 for an Extended Fund Facility, approximately USD 3 Bn. is to be received over a period of four years, with the continuity and completion depending on the stipulated criteria being met by each review date, especially with regard to achieving debt sustainability.
NBFI sector performance
As a country, we entered the financial year 2022/23 with numerous adversities in the background mentioned above and the Non-Bank Financial Institutions (NBFIs) sector was no exception. Muted economic activities and weak investor confidence meant that the NBFIs sector too had to contend with limited opportunities for credit expansion and all other business activities.
Overall, the performance of the NBFIs sector suffered a setback during the financial year 2022/23 in terms of new business, asset quality, and profitability. Although the overall net assets of the industry recorded a 12% growth, the total assets of the sector increased by just 3% or Rs. 46 Bn. during the year mainly due to an increase in short term investments in government securities and short term bank deposits.
The lending portfolio of the sector recorded a 4% negative growth due to the contraction of the finance leases and other secured loans portfolio. Lending gradually reduced because of the contraction of the leasing portfolio, mainly due to the continuation of restrictions imposed by the Government on the importation of motor vehicles as a measure to restrict foreign currency outflows.
The overall investment portfolio of the sector however increased by 28% due to investment of excess liquidity in short term government securities. Customer deposits continued to dominate the liabilities of the sector accounting for 56%, and the deposit base grew significantly at the rate of 13% during the year. As a result, total borrowings significantly declined.
The sector earnings and profitability was impacted mainly due to the repricing effect on the deposit base and the drop in repayment capacity of customers under the current economic conditions.
Performance of the Company
Asset quality and loan portfolio
Asset quality
Keeping aside our plans for growth, we quickly shifted gears during the year to focus on adapting to the highly uncertain economic, social, and political conditions, amidst muted credit demand and weakening debt repayment capacity of borrowers under near hyperinflationary context and ever rising interest rate scenario. On average, our lending portfolio accounts for 73% of our total assets and hence, the quality of our assets portfolio depends heavily on the quality of the lending portfolio. In addition, a detailed regulatory direction was issued for the classification and measurement of credit facilities to establish stringent credit risk management framework for the NBFI Industry which came into force with effect from 1 April 2022, as tabulated below.
Minimum criteria on impairment of financial instruments of the NBFIs that opted for transitional provisions are as follows. CDB too opted for transitional provision option considering deteriorating economic and macro conditions.
- Stage 1 – All credit facilities which are not categorised under Stage 2 or Stage 3 below.
- Stage 2 based on the past due dates given below.
| Facility type | 2022/23 days | 2021/22 days |
| Credit facilities repayable on a daily basis | 7 | 7 |
| Credit facilities repayable on a weekly/bi-weekly basis | 30 | 30 |
| Credit facilities repayable monthly or more | 60 | 60 |
Stage 3 based on the past due dates given below.
| Facility type | 2022/23 days | 2021/22 days |
| Credit facilities repayable on a daily basis | 15 | 15 |
| Credit facilities repayable on a weekly/bi-weekly basis | 60 | 60 |
| Credit facilities repayable monthly or more | 120 | 150 |
Below is a detailed account of how CDB effectively faced the challenges and managed external volatilities during the financial year.
Stage wise loan composition based on the previous loan classification criteria applicable for the financial year ended 31 March 2022 is given below. Stage 3 classification was based on 150 past due dates.
| As at 31 March | 2022 | |||
| Stage 1 | Stage 2 | Stage 3 | Total | |
| Gross portfolio (Rs. Bn.) | 72.04 | 6.60 | 4.81 | 83.45 |
| Portfolio Composition (%) | 86.34 | 7.90 | 5.76 | 100.00 |
Based on the adoption of 120 DPD Stage 3 classification, behaviour of the stage wise composition of the loans portfolio on a quarterly basis for the Financial Year ended 31 March 2023 are follows.
| 2023 | ||||
| Stage 1 | Stage 2 | Stage 3 | Total | |
| Q1 Portfolio (Rs. Bn.) | 67.70 | 7.74 | 9.44 | 84.88 |
| Q1 Portfolio Composition (%) | 80 | 9 | 11 | 100 |
| Q2 Portfolio (Rs. Bn.) | 71.35 | 3.60 | 11.63 | 86.58 |
| Q2 Portfolio Composition (%) | 83 | 4 | 13 | 100 |
| Q3 Portfolio (Rs. Bn.) | 60.09 | 11.62 | 9.61 | 81.32 |
| Q3 Portfolio Composition (%) | 74 | 14 | 12 | 100 |
| Q4 Portfolio (Rs. Bn.) | 61.32 | 9.62 | 10.47 | 81.41 |
| Q4 Portfolio Composition (%) | 75 | 12 | 13 | 100 |
The loan portfolio in Stage 1 came down to 74% as at 31 December 2022. However, we improved it to 75% by the end of the financial year. Similarly, Stage 3 (impaired loans) ratio increased to its highest level of 13% by the quarter ended 30 September 2022. However, by the year end, we maintain at 13%. Furthermore, we witnessed a significant increase in Stage 2 loans from 4% to 14% level during the year mainly due to the unfavourable macroeconomic conditions, coupled with the changes to the loan classification criteria implemented by regulatory directions. This trend of bucket movement of the portfolio is almost in line with the recovery path of the country which showcases the level of sensitivity of our customers to the macro conditions.
Loan portfolio
Gross loan portfolio also recorded a negative growth of 3% or a decline of Rs. 2.2 Bn. This was mainly due to the deliberate decision taken to curtail the growth of the loan book following the subdued credit appetite under highly stressed market conditions. Especially, given the near hyperinflationary environment, the demand for long-term loan products such as leasing, housing, and other long-term loans came to a complete standstill. In line with the management of the balance sheet position, our focus was mainly on recoveries and short-term loans. Accordingly, loan growth during the year under review came from gold loan and credit card portfolios. Gold loan portfolio increased to Rs. 15.79 Bn. from Rs. 10.77 Bn. as of the last year end, reflecting an increase of Rs. 5.02 Bn. or 47% growth. Credit card portfolio also recorded a 47% growth to Rs. 1.29 Bn. from Rs. 878 Mn. as of the last year end. With these changes of the loan portfolio, our exposure to gold loans increased to 21% of the total loan portfolio from 14% of the previous year end. Risk management section of this annual report details how we managed market and operational risks of the gold loan business considering the fact that the business growth mainly came from gold loan portfolio.
Concentration of the loan book under different product categories
| As at 31 March | 2022/23 Rs. ’000 | Composition % | 2021/22 Rs. ’000 | Composition % | Change Rs. ’000 |
% Change |
| Leasing and other long-term loans | 63,982,848 | 78.60 | 70,887,732 | 84.94 | (6,904,884) | (9.74) |
| Gold Loans | 15,789,950 | 19.40 | 10,773,585 | 12.91 | 5,016,365 | 46.56 |
| Credit Cards | 1,287,710 | 1.58 | 877,949 | 1.05 | 409,761 | 46.67 |
| Margin Trading | 345,696 | 0.42 | 919,000 | 1.10 | 573,304 | (62.38) |
| Total Portfolio | 81,406,204 | 100.00 | 83,458,266 | 100.00 | (2,052,062) | (2.46) |
| Impairment | (4,929,315) | 6.06 | (4,732,956) | 5.67 | 196,358 | 4.15 |
| Portfolio net of provisions | 76,476,889 | 78,725,310 |
Deposits from customers
Our deposit base grew by 20% YoY to Rs. 62,875 Mn. in FY 2022/23 from Rs. 52,216 Mn. in FY 2021/22. The growth in the deposit base mainly came from time deposits which recorded a growth of Rs. 10.9 Bn. or 22%. It is also evident that the average cost of the customer deposits also increased substantially from 7.29% of the year ago to 15.68% for the current year showcasing the impact of the current high inflation rate.
Growth in the Deposit Base and the Movement in Average Cost
| Facility type | 2022/23 Rs. Mn. | 2021/22 Rs. Mn. | 2020/21 Rs. Mn. | 2019/20 Rs. Mn. | 2018/19 Rs. Mn. |
| Time Deposits | 58,256 | 48,844 | 45,468 | 40,783 | 44,945 |
| Savings Deposits | 2,730 | 3,004 | 2,915 | 2,267 | 2,014 |
| Other Deposits | 1,889 | 369 | 436 | 256 | 264 |
| Total Deposits | 62,875 | 52,217 | 48,999 | 43,305 | 47,223 |
| Interest Cost on Deposits | 9,027 | 3,809 | 4,283 | 5,171 | 5,756 |
| Average Cost (%) | 15.68 | 7.29 | 9.28 | 11.42 | 12.52 |
Local and foreign borrowings
Our Corporate and Foreign Borrowings portfolio reduced by 33% to Rs. 20,460 Mn. in FY 2022/23 from Rs. 30,436 Mn. in FY 2021/22. Given the high borrowing cost and the muted demand for credit, there were no new borrowings during the year. Further, it is noteworthy to mention that even amidst the heightened foreign currency shortages, we honoured our foreign loan settlement commitments to our foreign funding partners who had placed enormous confidence in us for years.
Income
Fund based income
Net Interest income for the period decreased by 16% to Rs. 7,556 Mn. from Rs. 9,037 Mn. in the previous year mainly due to the sharp increase in market interest rates leading to the repricing of the customer deposit base faster than the assets portfolio. Interest expenses increased by a massive 104% to Rs. 12,577 Mn. compared to the 33% increase in interest income. Consequently, Net Interest Margin reduced to 7.18% for the year from 9.05% a year ago.
More than 90% of assets represents income generation assets while interest expense yield in liabilities are at 79%. Interest earning assets to interest bearing liabilities was maintained at around 115% (2021/22 – 115%).
Fee based income
Fee- based income from fees, commission, and other fee based income recorded a decrease of 60% YoY to Rs. 1,427 Mn. from Rs. 2,378 Mn. a year ago mainly due to substantial decline of pre-closures in comparison to the last financial year.
Decline in net interest income coupled with the decrease in other operating income contributed to a 21% negative growth in total operating income to Rs. 8,984 Mn. for the year from Rs. 11,415 Mn. in FY 2021/22.
Operating expenses
Total operating expenses swelled by 15% YoY to Rs. 5,073 Mn. from Rs. 4,412 Mn. a year ago. The increase was mainly contributed by premises, equipment, and establishment expenses due to the impact of inflationary pressures and rupee depreciation on the services obtained from both local and overseas suppliers. Total increase in the operating expenses amounted to Rs. 661 Mn. of which Rs. 629 Mn. (90% of the increase) was on account of premises, equipment and establishment expenses. As a result of the lower net interest margin, lower other operating income and increase in operating expenses, the cost to income ratio for the year under review increased to 56.47% from 38.65% of the year ago.
Profitability
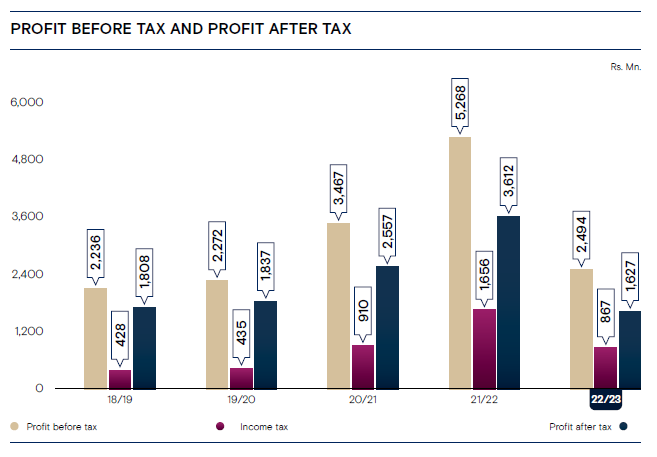
Profit before taxes for the year decreased by 53% to Rs. 2,494 Mn. from Rs. 5,268 Mn. in the previous year. This can be attributed to decreases in net interest income by 16% and other operating income by 40%, which led to a decrease in total operating income by 21%, and an increase in operating expenses by 15%.
Increase in taxes on financial services and NBT during year also contributed to the lower Profit before taxes. Income tax expenses decreased by 48% to Rs. 867 Mn. compared to Rs. 1,656 Mn in FY 2021/22.
Consequently, CDB recorded a Profit after tax of Rs. 1,626 Mn. for the year under review as against Rs. 3,612 Mn. in FY 2021/22, a decrease of 55%.
Accordingly, both Return on Average Assets and Return on Average Equity also reduced to 1.55% and 9.08% respectively for the year compared to 3.62% and 22.79% reported in FY 2021/22.
Liquidity
We continued to maintain liquidity levels above the regulatory minimum and stringent ALCO targets were maintained during the year. The fact that ours is a highly liquid balance sheet with 90% of regular cash flow generating assets, along with low contractual assets and liability maturity mismatches contributed to maintain liquidity at compatible levels. However, the impact of the upward movement in interest rates and the market response resulted in changes in client behaviour, disturbing the contractual maturity patterns leading to mass premature renewal of the deposit base. This resulted in an increase in interest cost despite having acceptable level of contractual maturity mismatches.
Capital
We have continued to bolster our capital levels over the past several years and as a result, we are in a satisfactory position today in meeting all the regulatory capital adequacy requirements. The growth in the gold loan portfolio composition from 14% to 21% as well as the contraction in overall assets being limited to 1% during the year had positive impacts on capital adequacy ratios. Our capital augmentation plan is in tandem with our plans for expansion of business and also is aligned to the risk profile of our business.
Capital Adequacy Ratios
| Ratio | 2022/23 | 2021/22 | 2020/21 | 2019/20 | 2018/19 |
| Core capital Ratio (%) | 16.23 | 15.16 | 12.10 | 10.25 | 8.09 |
| Total capital Ratio (%) | 17.35 | 17.07 | 15.34 | 13.29 | 11.07 |
Shareholder returns
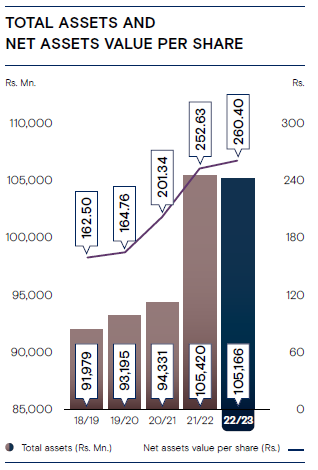
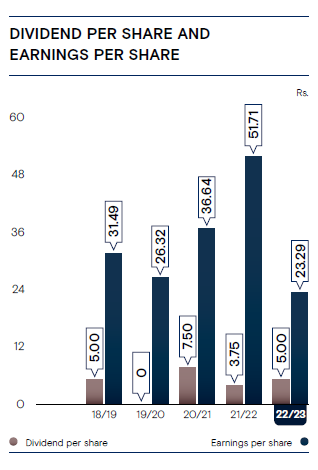
We proposed a dividend for 2022/23 of Rs. 5.00 per share which is 33% increase of the dividend declared in the previous year. Net Assets Value of the share as of 31 March 2023 was Rs. 260.40 (2022 – Rs. 252.63). Market Price of the voting and non-voting shares were recorded at Rs. 227.75 and Rs.79.10 respectively. Market price of the voting and non-voting shares recorded marginal declines of 1.30% and 8.13% respectively during the year under review.
Creating value for our investors
Investors play a vital role as key stakeholders in CDB's value creation process. They contribute significant financial capital, shape corporate behaviour, and have a profound impact on socio-environmental and governance aspects. CDB is dedicated to effectively managing risks and achieving sustainable growth, ensuring strong relationships with investors that foster transparency, trust, and informed assessments of the Company's present and future prospects.
CDB’s investor base consists of both individuals and institutions that provide essential financial capital for investments and development. The Company's primary objective is to generate value for its shareholders by managing risks and delivering sustainable growth and returns. To achieve this, CDB is committed to providing its investors with all the necessary information through regular engagement, cultivating mutual trust, and embracing accountability.
This approach allows investors to accurately assess CDB's performance and make well-informed judgments regarding the Company's future prospects. Moreover, CDB demonstrates its commitment to shareholders by consistently paying dividends. By nurturing these relationships, CDB aims to establish a strong foundation for long-term success and mutually beneficial partnerships with its investors.
A resilient performance
Capital market performance
The Colombo Stock Exchange (CSE) boasts a total of 296 companies, with a Market Capitalisation of Rs. 3,903.5 Bn. as of 31 March 2023. As for the market indices, the All Share Price Index (ASPI) closed at 9,301.10, while the S&P Sri Lanka 20 Index (S&P SL 20) stood at 2,682.8.
Throughout the financial year, CDB’s ordinary voting and ordinary non-voting shares experienced a drop of 1.30% and 8.8% respectively. The ASPI showed a year-on-year growth of 4.56% by the end of 31 March 2023.
CDB.N shares were traded within the range of Rs. 160.50 to Rs. 239.00, while CDB.X shares were traded between Rs. 51.00 and Rs. 86.10. In terms of overall market capitalisation, CDB experienced a 1.72% year-on-year depreciation.
Maintaining proactive and effective communication with investors and shareholders has been a priority for us. This commitment has fostered stronger relationships and improved organisational performance. To ensure transparent and timely disclosures, we have utilised various online and offline communication channels to engage with investors and provide them with relevant information.
Stock exchange listing
Citizens Development Business Finance PLC’s ordinary shares, which have been issued, are listed on the Main Board of the Colombo Stock Exchange.
The unaudited Interim Financial Statements for the three quarters of the 2022/23 financial year were submitted to the CSE within the required 45-day time frame. The unaudited Interim Financial Statements for the final quarter were submitted to the CSE within the specified 60-day period from the end of the quarter.
Comparison of CDB share movement with ASPI
| ASPI | CDB.X | CDB.N | |
| April 2022 | 7,624.26 | 68.00 | 201.00 |
| May 2022 | 8,108.09 | 62.30 | 199.75 |
| June 2022 | 7,342.33 | 54.20 | 180.00 |
| July 2022 | 7,731.15 | 57.00 | 175.00 |
| August 2022 | 9,071.32 | 65.40 | 217.75 |
| September 2022 | 9,931.07 | 65.40 | 195.00 |
| October 2022 | 8,728.60 | 61.50 | 190.00 |
| November 2022 | 8,651.00 | 55.90 | 200.00 |
| December 2022 | 8,490.00 | 53.40 | 190.00 |
| January 2023 | 8,865.00 | 57.20 | 190.00 |
| February 2023 | 9,188.50 | 60.90 | 199.25 |
| March 2023 | 9,301.10 | 79.10 | 227.75 |
Overall share market
As of 31 March 2023, the Colombo Stock Exchange market capitalisation of Rs. 3,903.50 Bn. This figure represents a growth of 2.01% compared to the previous year’s market capitalisation of Rs. 3,826.50 Bn.
| 31 March 2023 | 31 March 2022 | |
| All Share Price Index (ASPI) | 9,301.10 | 8,903.87 |
| S&P Sri Lanka 20 Index (S&P SL 20) | 2,682.80 | 3,031.16 |
| Market capitalisation (Rs. Bn.) | 3,903.50 | 3,826.50 |
Financial information
Highlights
| 2022/23 | 2021/22 | |
| Price earnings ratio (Times) | 9.78 | 4.46 |
| Earnings per share (Rs.) | 23.29 | 51.71 |
| Net assets value per share (Rs.) | 260.40 | 252.64 |
| Price to Book value (Times | 0.87 | 0.91 |
| Return on Equity (%) | 9.08 | 22.79 |
| Return on Assets (%) | 1.55 | 3.62 |
| Earnings Yield (%) | 10.23 | 22.41 |
| Dividend Yield (%) | 2.20 | 1.63 |
| Dividend payout (%) | 21.47 | 7.25 |
| Dividend Cover (Times) | 4.66 | 13.80 |
| Net interest margin (%) | 7.18 | 9.05 |
| Debt/Equity Ratio (Times) | 4.65 | 5.23 |
| Quick Assets Ratio (Times) | 0.83 | 0.95 |
| Interest Cover (Times) | 1.25 | 1.94 |
Dividends
For the fiscal year that concluded on 31 March 2023, CDB announced a first and final cash dividend of Rs. 5.00 per share for both its voting and non-voting shares subject to shareholder approval in the Annual General Meeting on 02 August 2023. The total dividend amount declared for voting shares was Rs. 297,561,875, while for non-voting shares it was Rs. 51,718,340. When combined, the dividend payouts amounting to Rs. 349,280,215.
Share price information
| Price (Rs.) | Voting | Non-voting | ||
| 2022/23 | 2021/22 | 2022/23 | 2021/22 | |
| High | 230.00 | 275.00 | 80.10 | 135.00 |
| Low | 175.50 | 100.25 | 51.00 | 70.00 |
| Last traded | 227.75 | 230.75 | 79.10 | 86.10 |
Share trading information
| 2022/23 | 2021/22 | 2020/21 | 2019/20 | 2018/19 | |
| Number of transactions | 638 | 2,703 | 1,556 | 1,401 | 1,970 |
| Number of shares traded | 5,682,209 | 1,928,617 | 2,497,879 | 5,647,980 | 2,735,334 |
| Value of shares traded (Rs.) | 1,135 | 282,060,872 | 240,347,905 | 500,892,517 | 229,888,715 |
Annual transaction information – Ordinary non-voting shares
| 2022/23 | 2021/22 | 2020/21 | 2019/20 | 2018/19 | |
| Number of transactions | 3,381 | 10,459 | 3,341 | 1,267 | 789 |
| Number of shares traded | 1,303,693 | 5,905,811 | 4,322,586 | 1,175,929 | 755,533 |
| Value of shares traded (Rs.) | 82.43 | 564,400,918 | 306,053,238 | 76,157,195 | 55,384,111 |
Market capitalisation
| Number of shares | MPS | 2022/23 | Number of shares | MPS | 2021/22 | |
| Voting | 59,512,375 | 227.75 | 13,553,943,406 | 59,512,375 | 230.75 | 13,732,480,531 |
| Non-voting | 10,343,668 | 79.10 | 818,184,139 | 10,343,668 | 86.10 | 890,589,815 |
| Total | 69,856,043 | 14,372,127,545 | 69,856,043 | 14,623,070,346 |
Float adjusted market capitalisation
| Number of shares | MPS | Market capitalisation Rs. | Percentage of public holders % | Float adjusted market capitalisation Rs. | |
| Voting | 59,512,375 | 227.75 | 13,553,943,406 | 44.19 | 5,989,487,591 |
| Non-voting | 10,343,668 | 79.10 | 818,184,139 | 83.88 | 686,292,856 |
| Total | 69,856,043 | 14,372,127,545 | 6,675,780,447 |
The Company’s float adjusted market capitalisation conforms to Option 5 outlined in Rule 7.13.1 (a) of the Listing Rules of the Colombo Stock Exchange. Additionally, the Company has successfully met the minimum public holding requirement specified under this particular option.
Outlook for 2023 and beyond
Serious implementation of the reforms will contribute to the improvement of the investment and business climate by financial stabilisation and the streamlining of outdated administrative procedures through digital transformation initiatives.
Otherwise the unique opportunities provides a unique opportunity to implement deep and permanent structural reforms that may be difficult under normal circumstances. We believe that Sri Lanka should use this opportunity to build a strong and resilient economy for our future generations.
We “Team CDB” have gone through many a shock during the first generation and had the resilience to come out of them. We are confident that our purpose coupled with exemplary governance and meticulous execution of strategy enables us to build an organisation that is highly resilient to the volatile and uncertain times expected to impact the next level of leadership.
Despite the challenges posed by the uncertain macroeconomic context, we will strongly commit ourselves to the three strategic priorities of Tech-Fin Transformation, one million customer base, and A Quarter Trillion Asset Base (Q-TAB) by 2030, in the immediate future.

Damith Tennakoon
Chief Financial Officer
28 June 2023 Colombo