Supplementary Reports
Value Added Statement
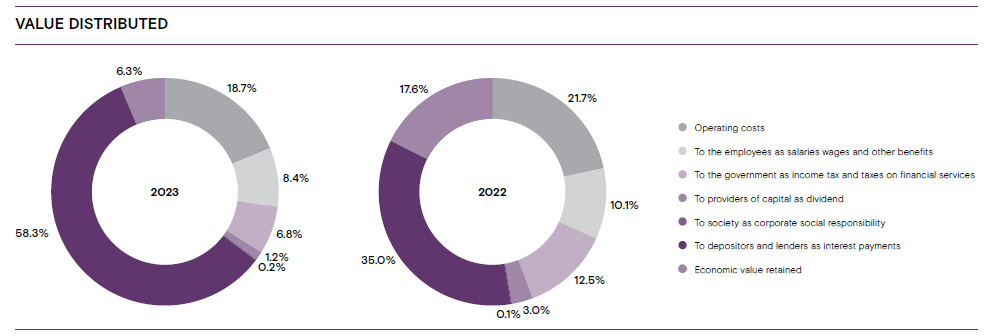
GRI 201-1
Value added aim to provide a value creation and distribution analysis of the Company among its key stakeholders.
| 2022/23 Rs. ’000 |
2021/22 Rs. ’000 |
Increase % |
|
| Value Created | |||
| Interest income | 20,133,427 | 15,194,413 | |
| Fee commission income | 242,015 | 311,128 | |
| Other operating income | 1,185,752 | 2,066,613 | |
| Total direct economic value generated | 21,561,194 | 17,572,154 | 23 |
| Value distributed | |||
| Operating costs | 4,040,715 | 3,809,628 | |
| To the employees as salaries wages and other benefits | 1,806,530 | 1,772,596 | |
| To the government as income tax and taxes on financial services | 1,472,655 | 2,195,608 | |
| To providers of capital as dividend | 261,960 | 523,447 | |
| To society as corporate social responsibility | 37,396 | 25,384 | |
| To depositors and lenders as interest payments | 12,577,015 | 6,156,858 | |
| Total economic value distributed | 20,196,271 | 14,483,521 | 39 |
| Economic value retained | 1,364,923 | 3,088,633 | -56 |