Supplementary Reports
Quarterly Statistics 2022-23
| 2022/23 |
2021/22 |
|||||||
|
30 June 2022 |
30 September 2022 |
31 December 2022 |
31 March 2023 |
30 June 2021 |
30 September 2022 |
31 December 2021 |
31 March 2022 |
|
| Statement of profit or loss (Rs. ’000) | ||||||||
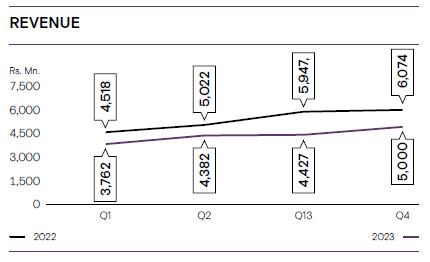
| Revenue | 4,518,452 | 5,021,965 | 5,947,031 | 6,073,746 | 3,762,157 | 4,382,100 | 4,427,919 | 4,999,978 |
| Net interest income | 2,035,891 | 1,617,109 | 1,955,337 | 1,948,075 | 1,801,362 | 2,070,984 | 2,381,676 | 2,783,533 |
| Total operating income | 2,208,761 | 1,910,653 | 2,390,814 | 2,473,951 | 2,208,761 | 2,910,322 | 2,951,984 | 3,344,229 |
| Net operating income | 2,275,477 | 1,874,746 | 2,229,451 | 1,793,387 | 1,780,908 | 2,625,464 | 2,810,014 | 3,003,765 |
| Non-interest expenses | 1,426,038 | 1,433,806 | 1,625,363 | 1,193,635 | 1,160,806 | 1,321,566 | 1,399,862 | 1,069,973 |
| Profit before tax | 849,439 | 440,940 | 604,088 | 599,752 | 620,102 | 1,303,898 | 1,410,152 | 1,933,792 |
| Income tax expense | 250,000 | 80,000 | 274,247 | 263,089 | 175,000 | 360,000 | 348,550 | 772,314 |
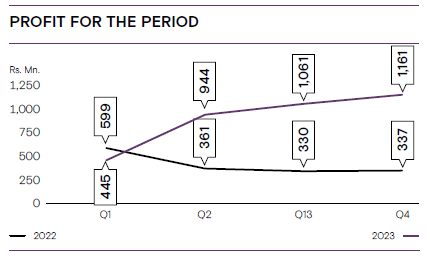
| Profit for the period | 599,439 | 360,940 | 329,841 | 336,663 | 445,102 | 943,898 | 1,061,602 | 1,161,478 |
| Statement of financial position (Rs. ’000) | ||||||||
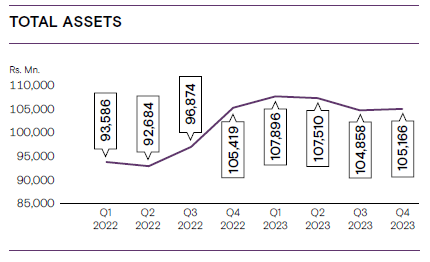
| Total assets | 107,895,704 | 107,509,665 | 104,857,610 | 105,165,711 | 93,586,498 | 92,684,007 | 96,873,639 | 105,419,983 |
| Loans and advances to customers | 80,038,919 | 80,564,008 | 77,642,886 | 76,476,889 | 73,963,677 | 74,080,553 | 76,520,471 | 78,725,310 |
| Deposits and borrowings | 84,082,126 | 83,386,258 | 83,052,657 | 83,335,925 | 75,334,040 | 74,285,543 | 76,964,147 | 82,908,327 |
| Shareholders’ funds | 17,407,227 | 17,589,224 | 18,012,039 | 18,190,221 | 14,416,737 | 15,066,677 | 16,317,239 | 17,648,075 |
| Key ratios | ||||||||
| Net assets value per share (Rs.) | 249.19 | 251.79 | 257.85 | 260.40 | 206.56 | 215.88 | 215.88 | 252.63 |
| Return on average shareholders’ equity (Annualised) (%) | 13.68 | 10.90 | 9.65 | 9.08 | 12.51 | 19.08 | 19.08 | 22.79 |
| Net Non-performing loans ratio* (%) | 3.55 | 4.67 | 5.61 | 5.12 | 2.86 | 1.80 | 1.34 | 0.11 |
| Core capital adequacy ratio (Tier I) | 14.56 | 15.17 | 15.61 | 16.23 | 11.70 | 12.88 | 12.88 | 15.16 |
| Total Capital Adequacy Ratio (Tier I and II) | 16.46 | 17.28 | 17.46 | 17.35 | 14.72 | 15.90 | 15.90 | 17.07 |